
Energy Balance
This page visualizes the progression of the energy generation and energy consumption for a selected period. provides analyses for generation, consumption, self-consumption and battery usage.
A two-part diagram displays how the loads in your system have been supplied and how your PV energy has been used:
The upper half of the diagram shows the total consumption of your system in the selected period.
It is precisely broken down from which sources your system was supplied with energy (PV system, battery-storage system or utility grid).The lower half of the diagram shows when and how much electrical PV energy has been generated and how it was used (direct consumption, charging of a battery-storage system or utility grid feed-in).

The data on this page are only fully displayed if both a feed-in meter and grid-supply meter are connected.
The additionally required PV generation data will be determined either directly by the connected SMA inverters or can be captured via an additional PV production meter in PV systems with Sunny Home Manager. If a DC-coupled storage system is used (e.g. Sunny Boy Smart Energy), the PV production data must always be read out directly from the device, otherwise no differentiation between direct consumption and battery charging or discharging is possible.
Via Tabs you can select the period which is to be displayed in the view (current / day / month / year / total). In the diagram, you can select a different time section either by clicking on the diagram with the mouse and moving the mouse to the right or left while holding down the left mouse button, or by moving the time section using the arrow keys below the diagram. You can use the magnifying glass symbol at the top right to reduce the view again if a display range has been enlarged.
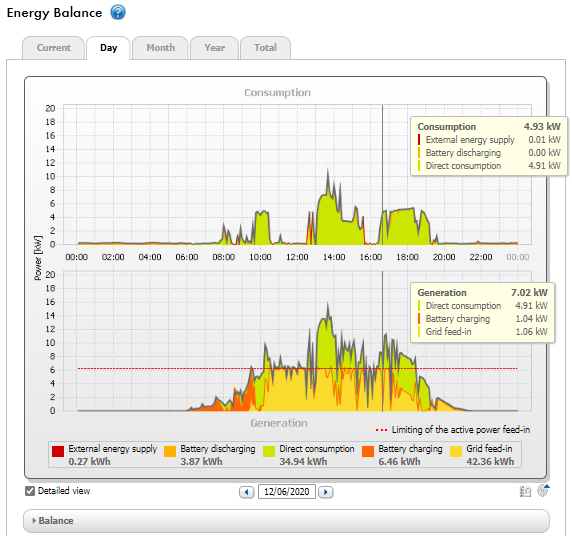
Energy balance of a specific day (example)
Reading out the data
- When you move the mouse pointer over the diagram, a vertical line is displayed. You can use this line to move to a specific point in time on the time axis. The power or energy values of the diagram for this required point in time are displayed.
- When you move the mouse over one of the displayed terms in the legend, an explanation of this term is displayed.
- If you want to display only selected data, click with the mouse on one or more terms in the legend to hide or show them again.
Energy consumption and energy generation
Designation | Explanation |
|---|---|
Consumption | Power that your household drew from your system (direct consumption or internal power supply for systems without battery), the utility grid (grid-supplied power) and, if applicable, the battery (battery discharging) during the period selected. |
Grid supply | Energy that was drawn from the utility grid during the period selected. |
Internal power supply | Energy used in the system that did not come from the utility grid, but rather was generated on site. It is made up of directly used PV energy (direct consumption) and stored PV energy (battery discharging). The internal power supply quota describes which proportion of the energy used in the system comes from that generated on site. |
Yield | Energy that was supplied to your household by your PV system during the period selected. For systems with battery, the energy comes preferably directly from the system (direct consumption). If the power produced by the system is not sufficient, the remaining power is supplied by discharging the battery. |
Self-consumption | PV energy that is used on-site and not fed into the utility grid. It is made up of directly used PV energy (direct consumption) and stored PV energy (battery charging). The self-consumption quota describes which proportion of the PV energy generated on-site has been used on-site. |
Grid feed-in | Energy that your PV system fed into the utility grid during the period selected. |
Self-sufficiency quota | Ratio of energy self-sufficiency to consumption in the period selected |
Only displayed for systems with battery: | |
Direct consumption | Power that your household drew and consumed directly from your PV system during the period selected, without intermediate storage in the battery. |
Direct consumption quota | Current ratio of direct consumption to PV power |
Battery charging | Energy that your PV system stored in the battery during the period selected. |
Battery discharging | Energy that your household drew from the battery during the period selected. |
On the tabs Current and Day the gray envelope curve visualizes the consumption (grid-supplied power and energy self-sufficiency) and the generation (direct consumption and grid feed-in) for the selected period or the selected day. On the tabs Month, Year and Total the gray envelope curve visualizes the generation (direct consumption and grid feed-in) for the selected period. The envelope curve is only visible if the data are incomplete or cannot be calculated, or if the components of the generation are hidden using the legend below the diagram.
The Legend below the diagram explains the colors used in the diagram and displays the most important overall values for the time period displayed.
Under Balance, the calculated values for the self-sufficiency and self-consumption quota, which reflect the type of your own energy supply, as well as other total values for the period shown are displayed.
Representation of limitation of active power feed-in
The dotted red line indicates the maximum active power that may be fed into the utility grid.
The red dashed line is only displayed on the Day tab in the Generation diagram - and only if you have set a limitation of active power feed-in for your PV system in Sunny Home Manager.
If you have limited the active power feed-in to 0%, the red line runs directly on the x-axis of the diagram. Limitation of the active power feed-in to 0% is only supported by inverters that support the fallback function (fallback: in the event of a communication failure between the Sunny Home Manager and the inverter, the inverter reverts to an output power of 0 watts). For more information see the inverter manual at www.SMA-Solar.com.
Display with Battery
If a battery inverter is present in your system, you can select between the simplified view without battery data and the detailed view with battery data. To have the battery data in the diagram and in the Balance area displayed, you must activate or deactivate the checkbox Detailed view.
Representation of purchased energy limit of the peak load shaving
The blue dashed line indicates the maximum amount of active power that may be drawn from the utility grid.
The blue dashed line is displayed only on the Day tab in Diagram Generation.