
P_AV,E active power limit curve
The following figure shows an application of the PAV,E monitoring in the passive reference system.
Up to a value of ∑PEMax, the PAV,E active power limit curve follows the function P(t) = - [(∑PEMax - PAV,E) ∙ e(-1.05∙(t-0.8)) + PAV,E].
This figure exemplifies the PAV,E active power limit curve with PAV,E/ ∑PEMax = 40%.
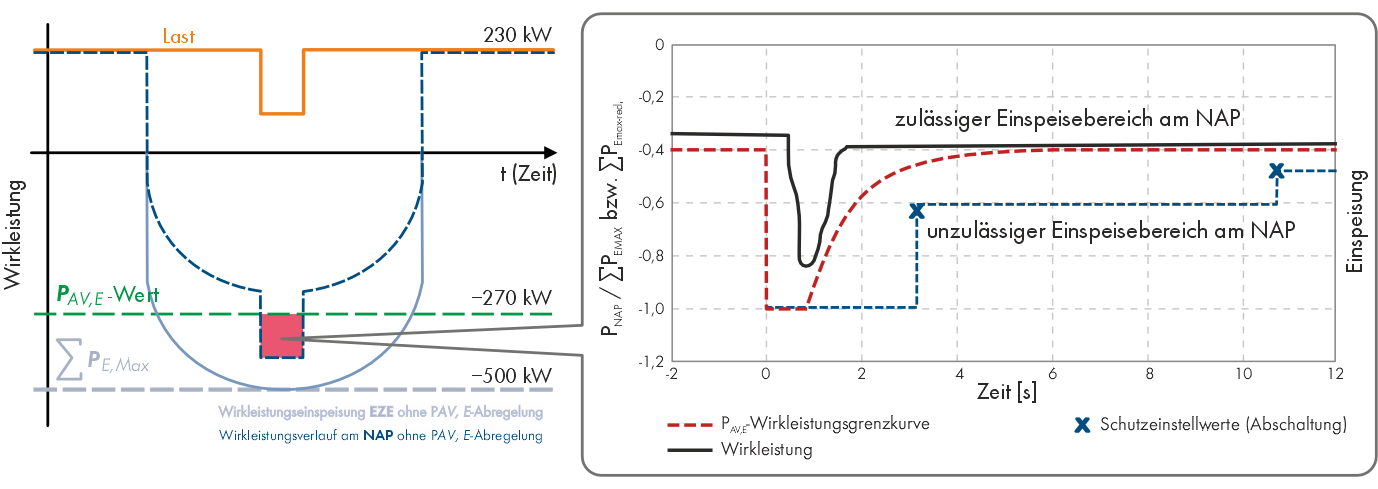
Example PAV,E active power limit curve
The limit curve to be observed can be achieved with the SMA Data Manager in connection with SMA inverters. The requirements for this can be found in the manufacturer's declaration under the following link: "Operation of a PV system with SMA PV inverters connected to a low-voltage terminal according to the feed-in power limitation function (PAV,E monitoring) as per VDE-AR-N 4105:2018, especially PAV,E monitoring (feed-in power limitation function)" at www.SMA-Solar.com.
Advantages of a single-step PAV,E control (through a system controller) compared to a PAV,E protective device:
Refers to the individual power-generating unit (PGU) and not to the grid and PV system protection of the power generation system (PGS)
No linking with grid and PV system protection concept necessary
No gradual losses due to disconnection, but an even reduction of the active power
No waiting period and no gradients when reconnection occurs (10%/min, 10 minutes until full power)
No effects on the inverter's service life
No additional components necessary
Simple commissioning/configuration with the SMA Data Manager
However, the use of a protective relay can be useful under certain conditions, such as permanently high base loads and the integration (connection) of loads. In cases of high oversizing rates (< 0.54), an additional, redundant protective device is often required.