
Visualization in Sunny Portal powered by ennexOS
For off-grid and remote PV systems, having the option of remote visualization and parameterization of the PV system parameters, PV performance, PV production and battery state of charge, diesel fill level, etc. is of great importance. Off-grid systems by SMA offer this functionality together with the Data Manager M or Data Manager M Lite via the Sunny Portal powered by ennexOS.
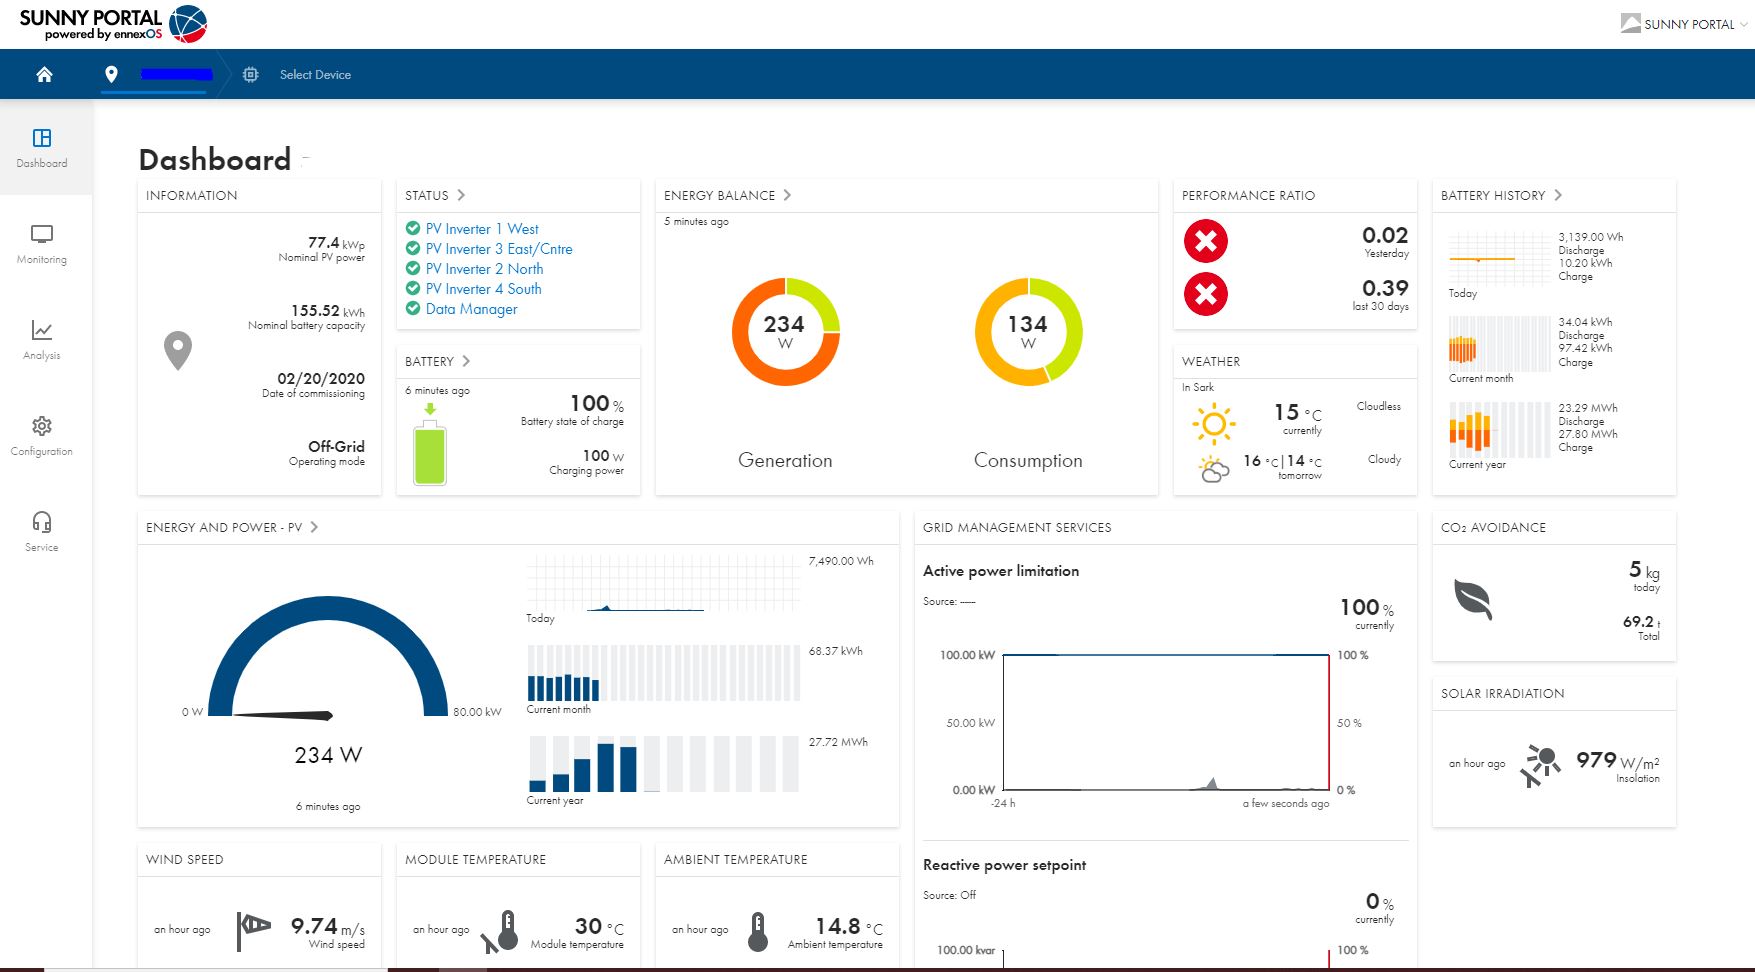
Sunny Portal powered by ennexOS, dashboard
In the Monitoring > Energy balance menu, you can choose from different diagrams.
If you select Energy bar on the right in the drop-down menu, a clear graphic of the energy flow of the system as well as the aggregated state of charge of all Sunny Island clusters is shown:
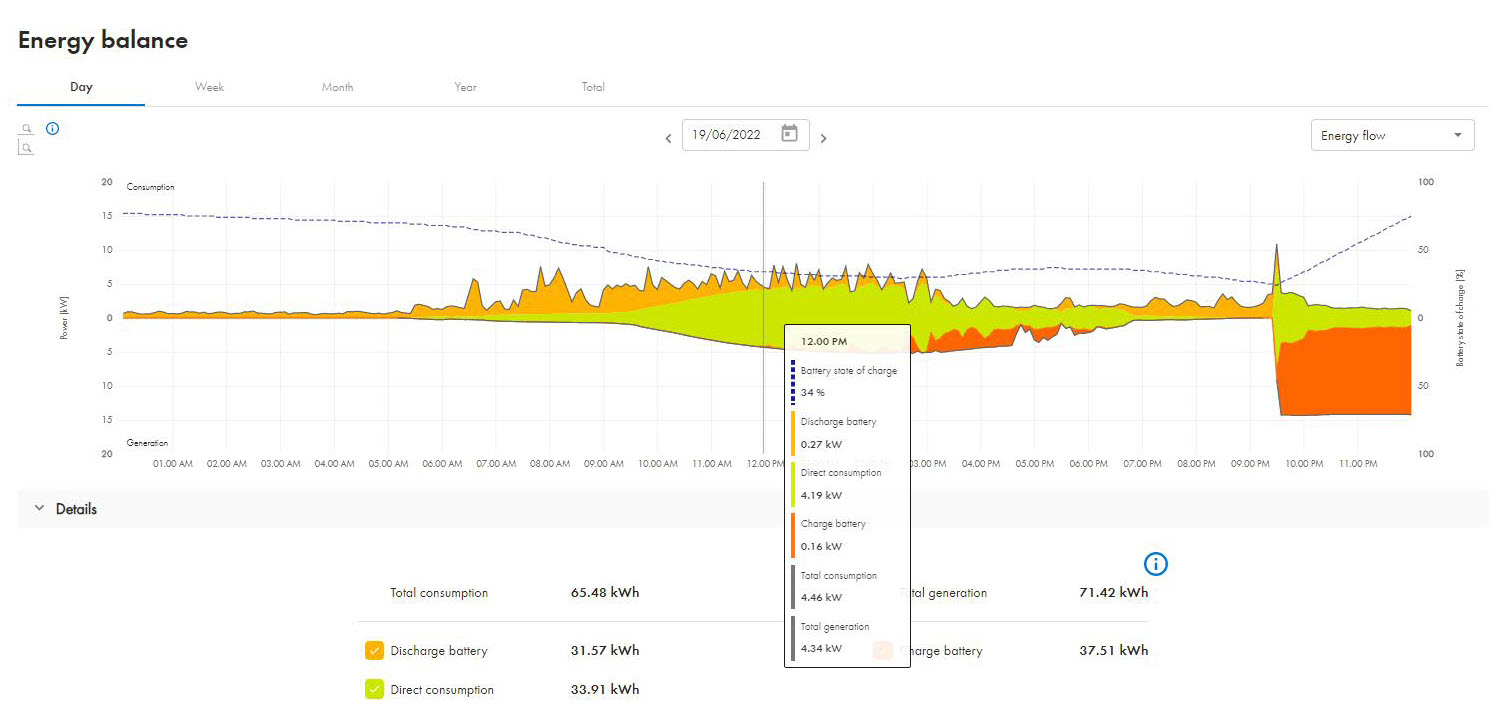
Representation of the energy flows in the energy balance menu
If you select Energy sources on the right in the drop-down menu, the different energy sources are shown:
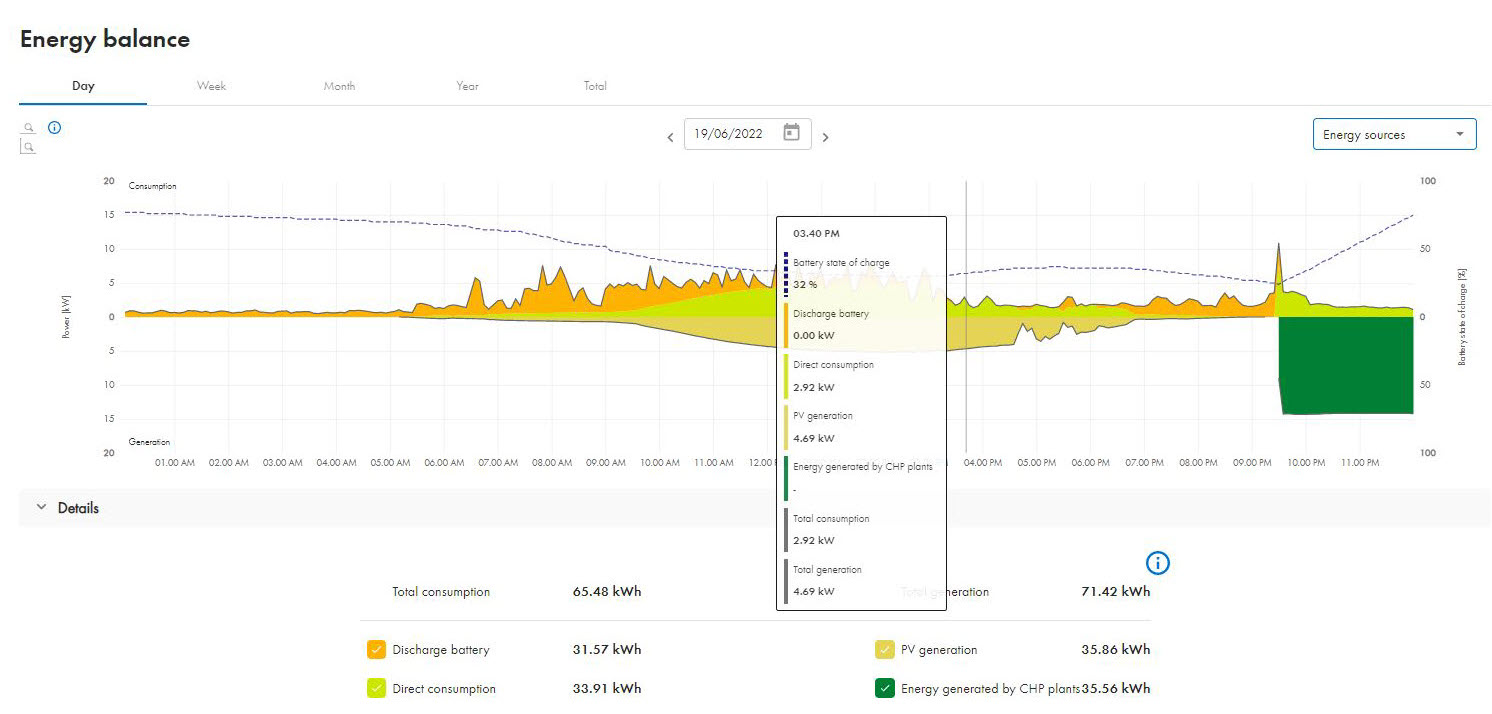
Representation of the energy sources in the energy balance menu
In the Monitoring > Energy and power menu, all available energy and power values are shown.
The energy and power values of the batteries are shown under Monitoring > Energy and power - battery:
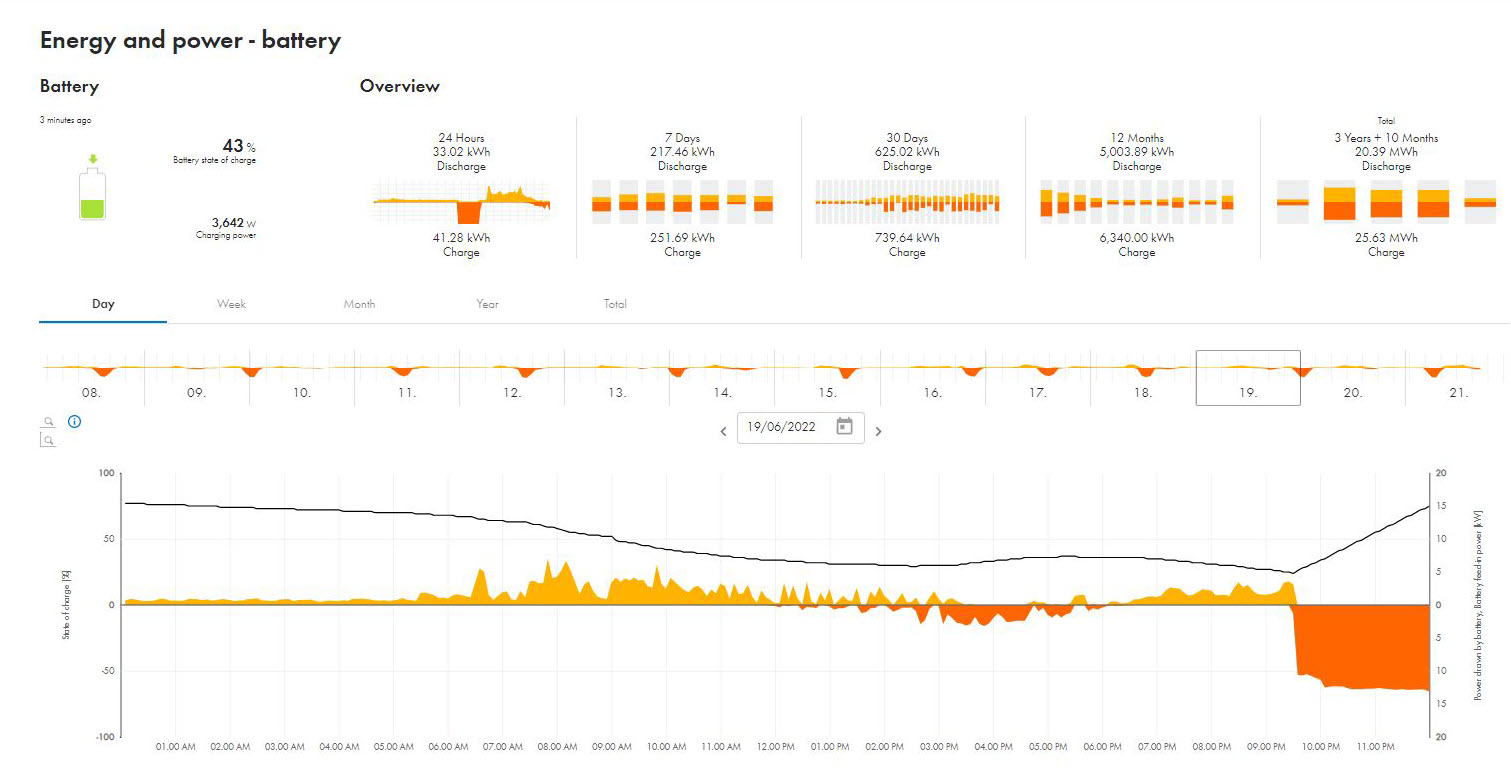
Energy and power values of the batteries (example)
The energy and power values of your PV system are shown under Monitoring > Energy and power - PV:
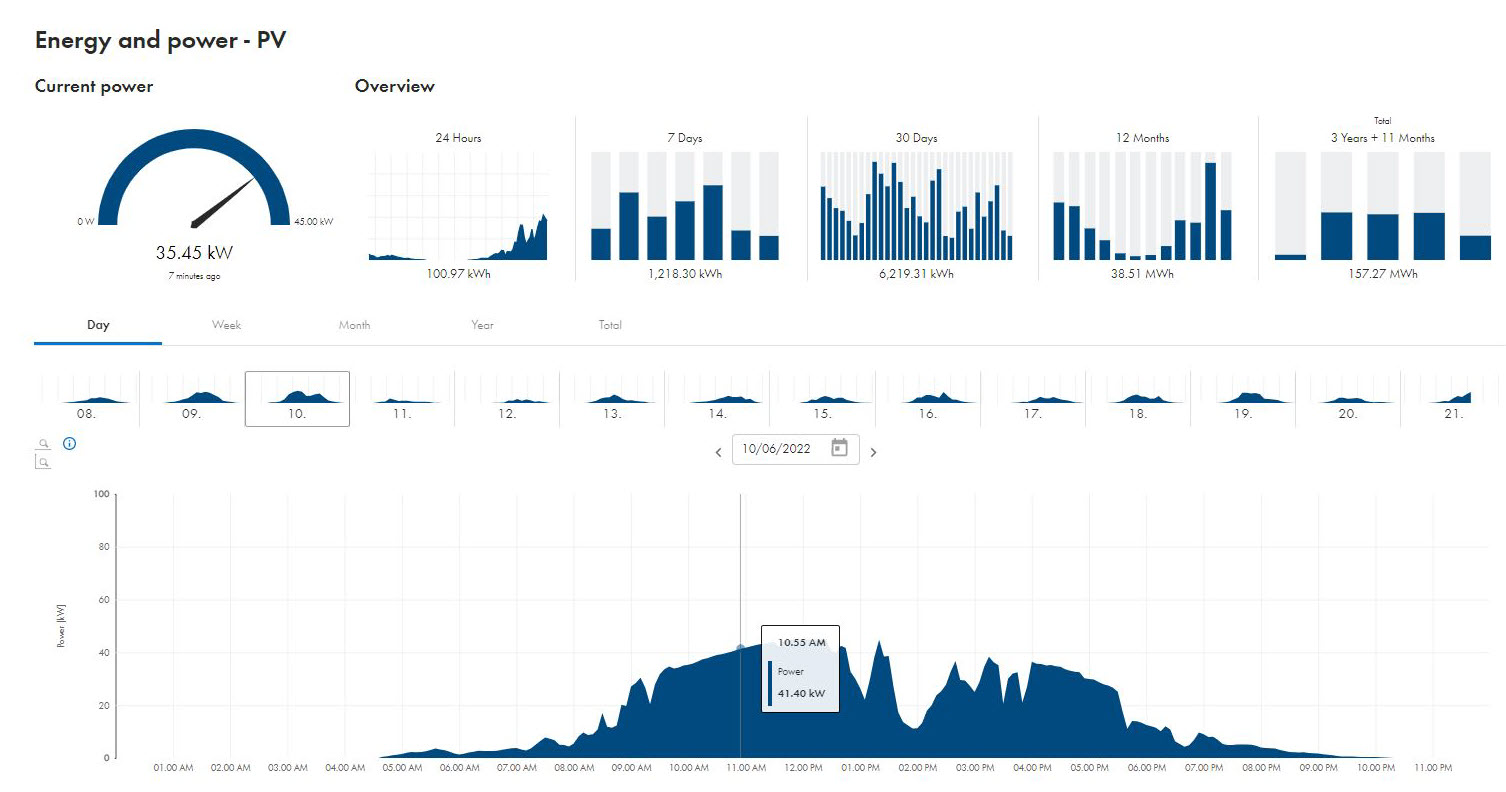
Energy and power values of the PV system (example)
The energy and power values of the diesel generator are shown under Monitoring > Energy and power - diesel.
It also possible to add a diesel generator as a virtual generator in Sunny Portal powered by ennexOS which will then be shown in the energy balance. The associated measured data can be called up via the internal measurement of the Sunny Island, but also via an external meter.
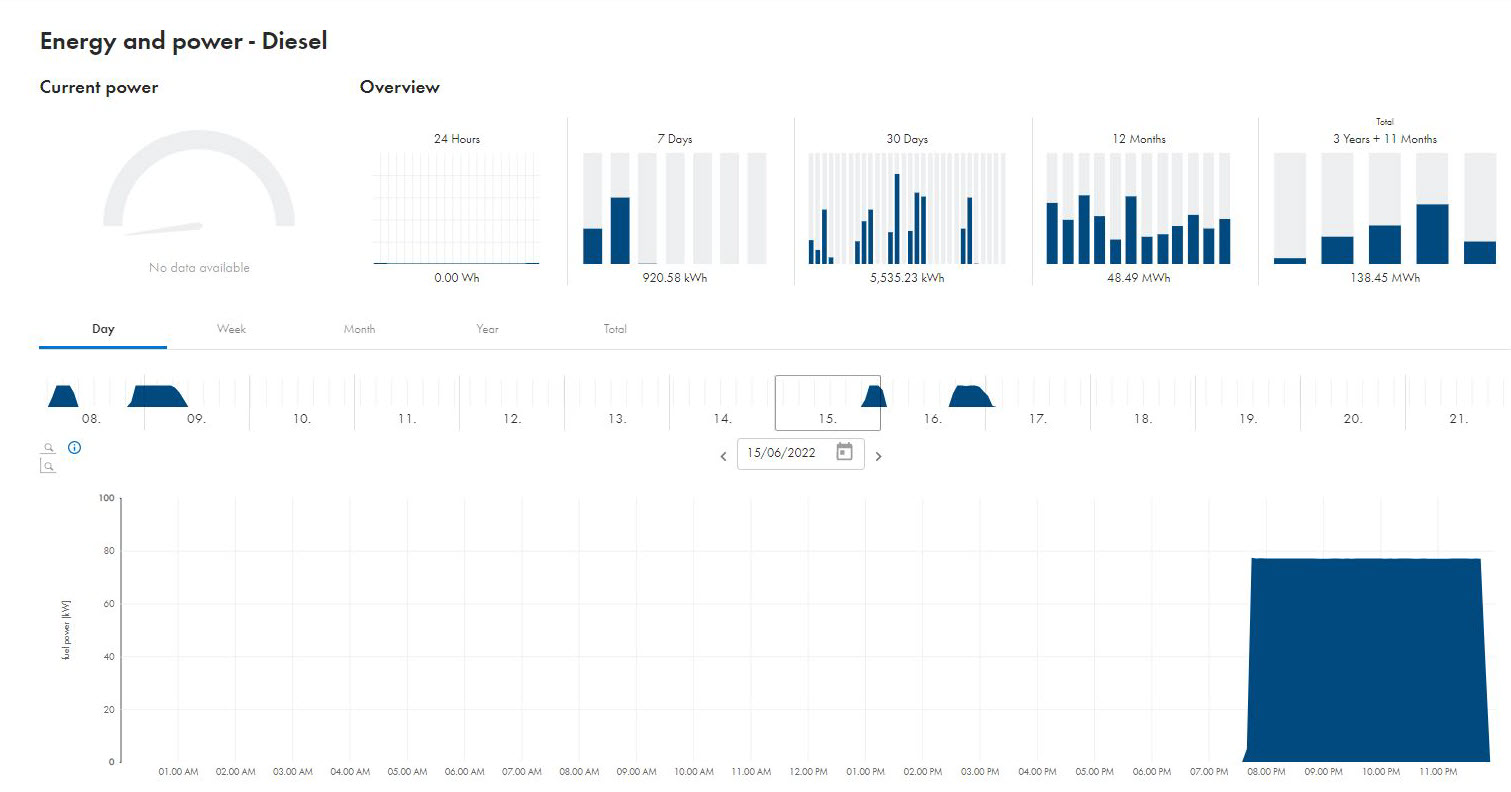
Energy and power values of the diesel generator (example)
In the menu Analysis > Analysis Pro it is possible to analyze a number of recorded AC and DC measured values as well states, warnings and error messages of the devices (PV inverters, battery inverters, etc.):
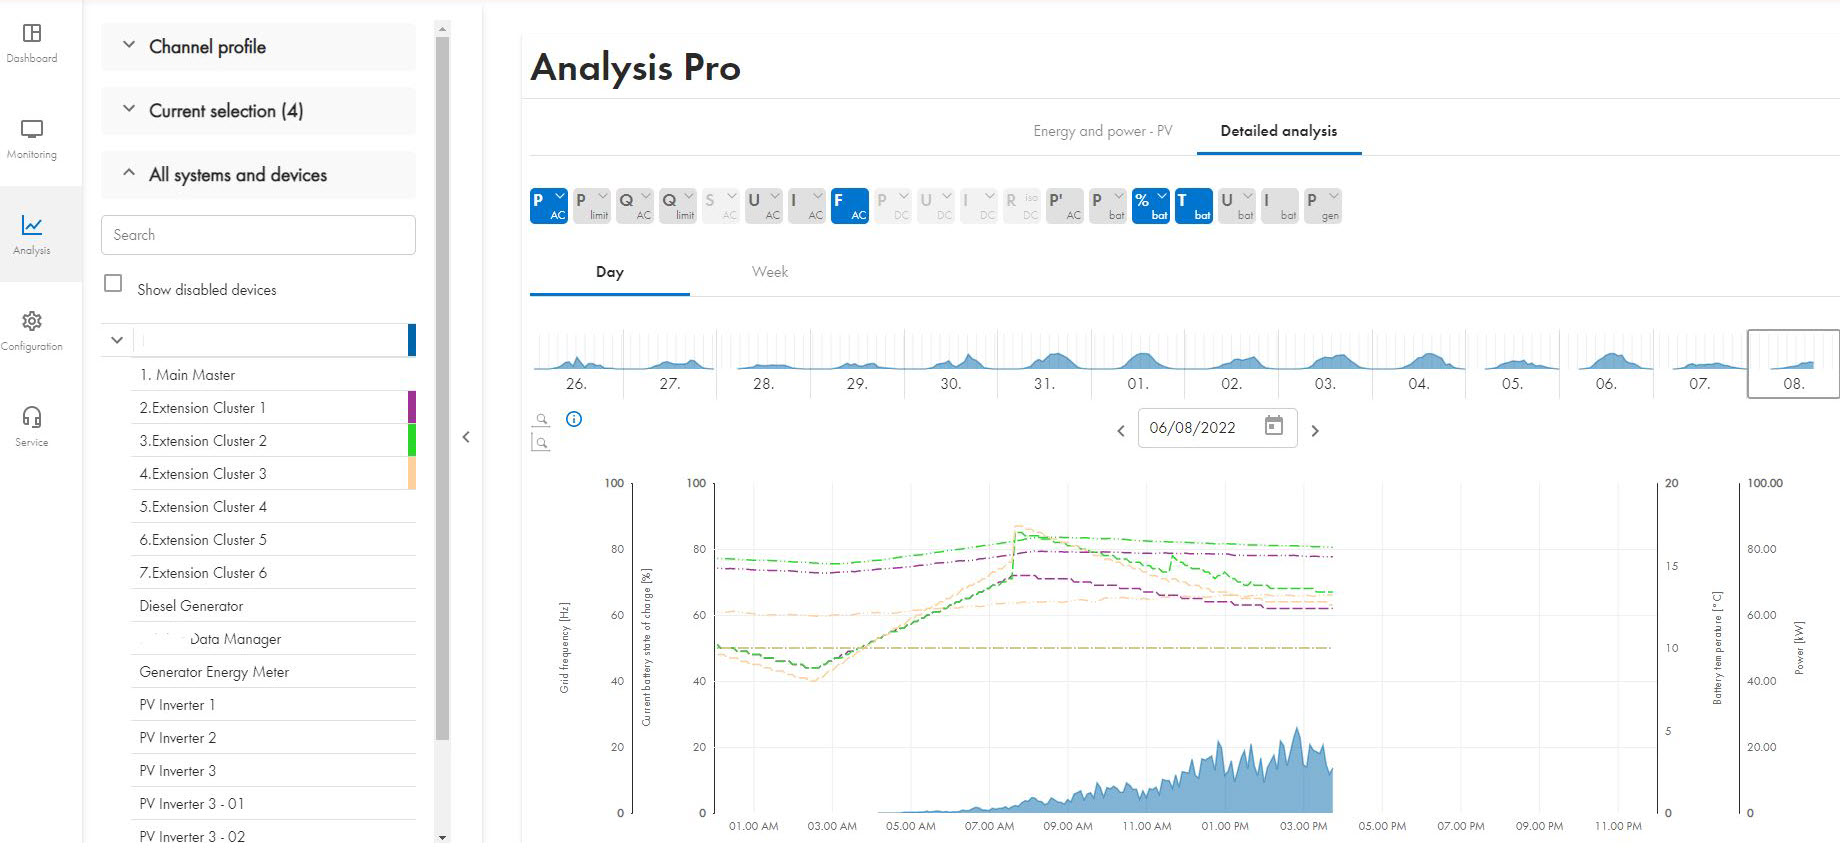
Data on the Analysis Pro page (example)

In the menu Analysis Pro, the measured data are always shown on the device with which they were measured. Therefore, the power of a diesel generator, for example, cannot be found among the virtual devices, but e.g. under the main cluster or an external energy meter.
Analysis Pro offers many more options for representation and analysis, for example:
Comparison of PV production and PV inverter production
Comparison of battery state of charge, voltage, charging and discharging current as well as with several clusters, the comparison of these values in various clusters
Representation of AC frequency and voltage per line conductor
Representation of active power, reactive power and apparent power per line conductor
Representation of AC current per line conductor
Representation of the energy balance of a virtually added diesel generator
Via freely configurable analog and digital inputs, the fill level of a diesel tank can be displayed, for example.
If you have solar irradiation, wind speed or temperature sensors installed, you can visualize and compare these data.
In the Event monitor area of the Analysis Pro menu, you can monitor information, warnings and error messages of the devices:
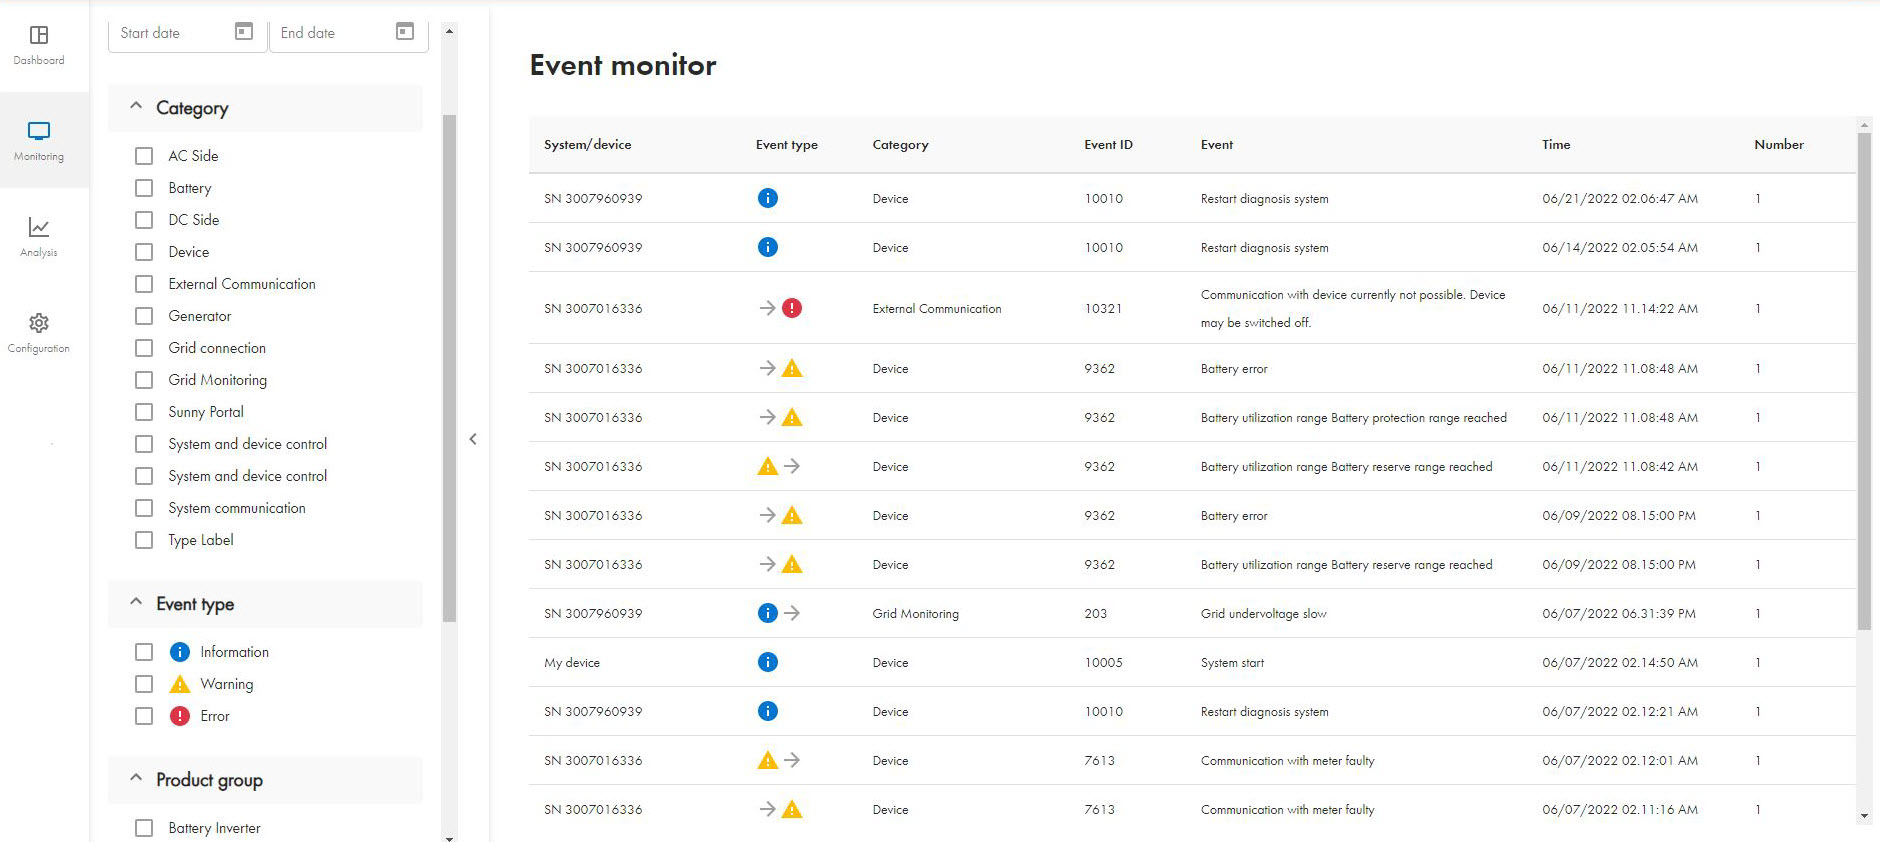
Data in the area Event monitor of the Analysis Pro page (example)
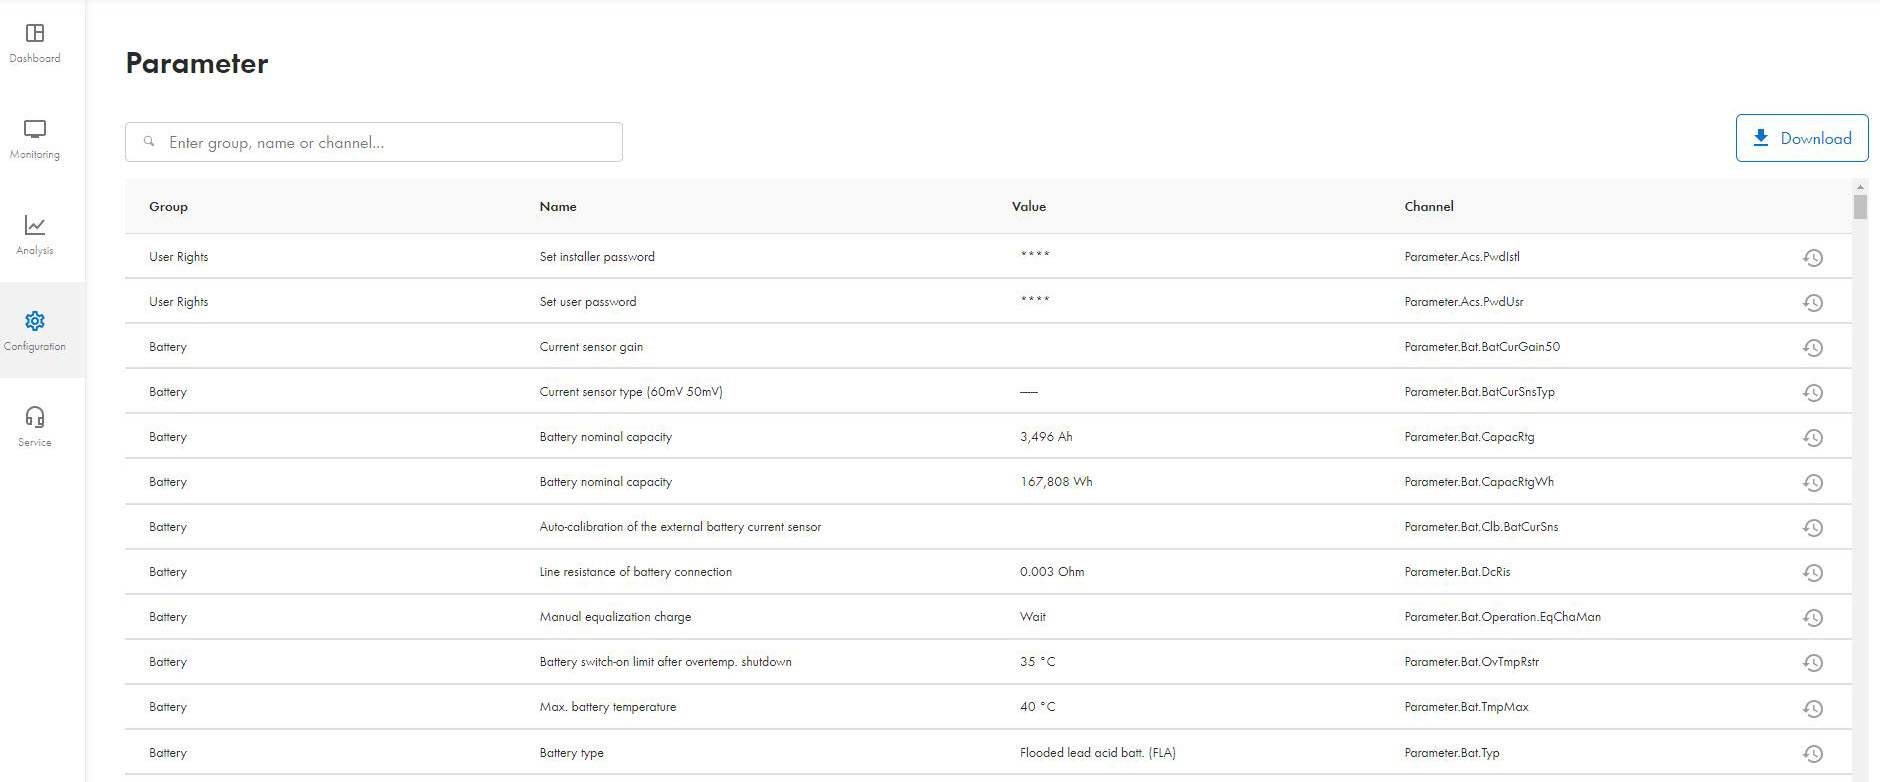
In the Configuration menu, you can carry out the remote parameterization of PV systems via the Parameter page
For PV systems with Sunny Island, this is possible from firmware version 3.30.12.R.
Many Sunny Island parameters can only be adjusted if the device is in standby mode. However, since the Sunny Island does not provide an AC grid in standby mode, you first must ensure the stand-alone mode either via the diesel generator or at least supply the Data Manager M and the internet router using an uninterruptible power supply (UPS) or a DC-DC converter with power from the battery.
The Sunny Portal powered by ennexOS has many other functions such as displaying additional measuring points (e.g. of certain loads) by means of installed energy meters. Various user rights can also be assigned as well as individual devices monitored separately.